(under construction)
There are a number of issues in understanding Windows security event logging (Auditing). Every 2 - 8 weeks I collect a 614MB Security archive with just my laptop and the audit categories below. Visualizing and manipulating this data effectively... Here are some solutions using Powershell with R 3.01.
# cmd.exe
auditpol /get /category:* | findstr "Success and Failure"
Security State Change Success and Failure
Logon Success and Failure
Logoff Success and Failure
Special Logon Success and Failure
Other Logon/Logoff Events Success and Failure
SAM Success and Failure
Filtering Platform Connection Success and Failure
Process Creation Success and Failure
Audit Policy Change Success and Failure
Filtering Platform Policy Change Success and Failure
Credential Validation Success and Failure
dir Archive-Security*
08/05/2013 07:10 PM 614,993,920 Archive-Security-2013-08-06-03-08-19-664.evtx
10/15/2013 06:03 AM 614,993,920 Archive-Security-2013-10-15-14-02-30-799.evtx
11/11/2013 03:24 PM 614,993,920 Archive-Security-2013-11-11-23-22-01-628.evtx
11/29/2013 02:44 PM 614,993,920 Archive-Security-2013-11-29-22-42-02-702.evtx
12/31/2013 07:45 PM 614,993,920 Archive-Security-2014-01-01-03-41-01-190.evtx
01/29/2014 01:34 PM 614,993,920 Archive-Security-2014-01-29-21-32-03-638.evtx
101 File(s) 43,706,841,928 bytes
#Powershell (See Avoiding XPath : Part I for the front part of this...)
$d=($c[0].get_Entries())[0..100000]| Select Index,TimeGenerated,EventID,Message
$d | export-csv Security.csv -NoTypeInformation
$e=($c[0].get_Entries())[100001..200000]| Select Index,TimeGenerated,EventID,Message
$e | export-csv Security001.csv -NoTypeInformation
# R
library(plyr) # 'count'
library(data.table) # 'data.table'
library(lattice) # 'barchart'
library(ggplot2)# 'arrange'
d <- read.csv("Security.csv")
e <- read.csv("Security001.csv")
DF <- merge.data.frame(d,e,all=TRUE)
DT <- data.table(DF)
setkey(DT,Index)
DF_count <- data.frame(count(DT$EventID))
arrange(DF_count,freq)
DF_arrange <- (arrange(DF_count,freq))
barplot(DF_arrange$freq,names.arg=(DF_arrange$x),xlab="EventIDs", ylab="EventIDs Count" )
 |
| General barplot of Security log event counts for 200K events. |
 |
| Lattice Graphics uses a bivariate trellis to produce multiple panels. |
 |
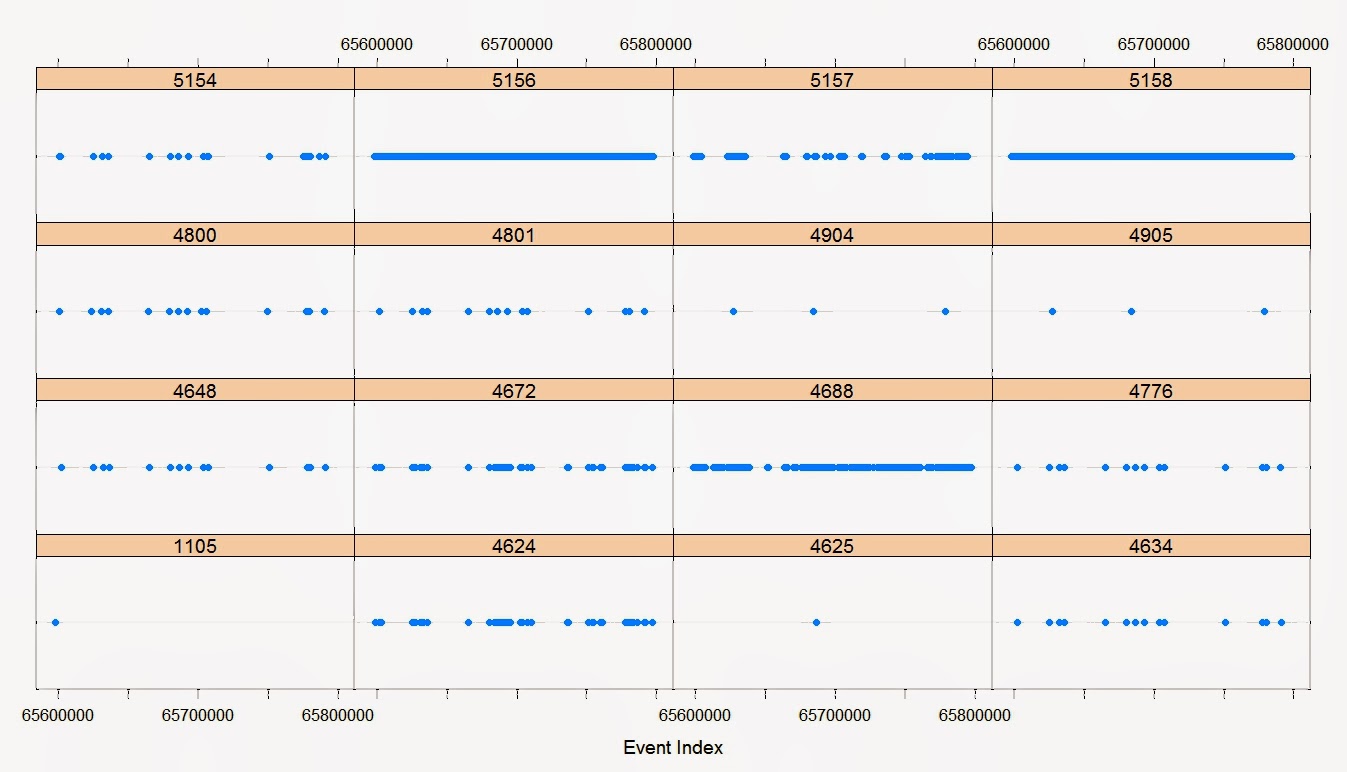
| Event Logs over Time (using Event Indexing) |
DF4688 <- data.frame(DT[EventID=="4688"])
DF5154 <- data.frame(DT[EventID=="5154"])
DF5157 <- data.frame(DT[EventID=="5157"])
DF4624_4688 <- merge.data.frame(DF4624,DF4688,all=TRUE)
DF5154_5157 <- merge.data.frame(DF5154,DF5157,all=TRUE)
DF4624_4688_5154_5157 <- merge.data.frame(DF4624_4688,DF5154_5157,all=TRUE)
DF_TG <- DF4624_4688_5154_5157
dotplot(~as.numeric(DF_TG$Index) | as.factor(DF_TG$EventID), xlab="Event Index"
 |
| Selected Auditing Events. |
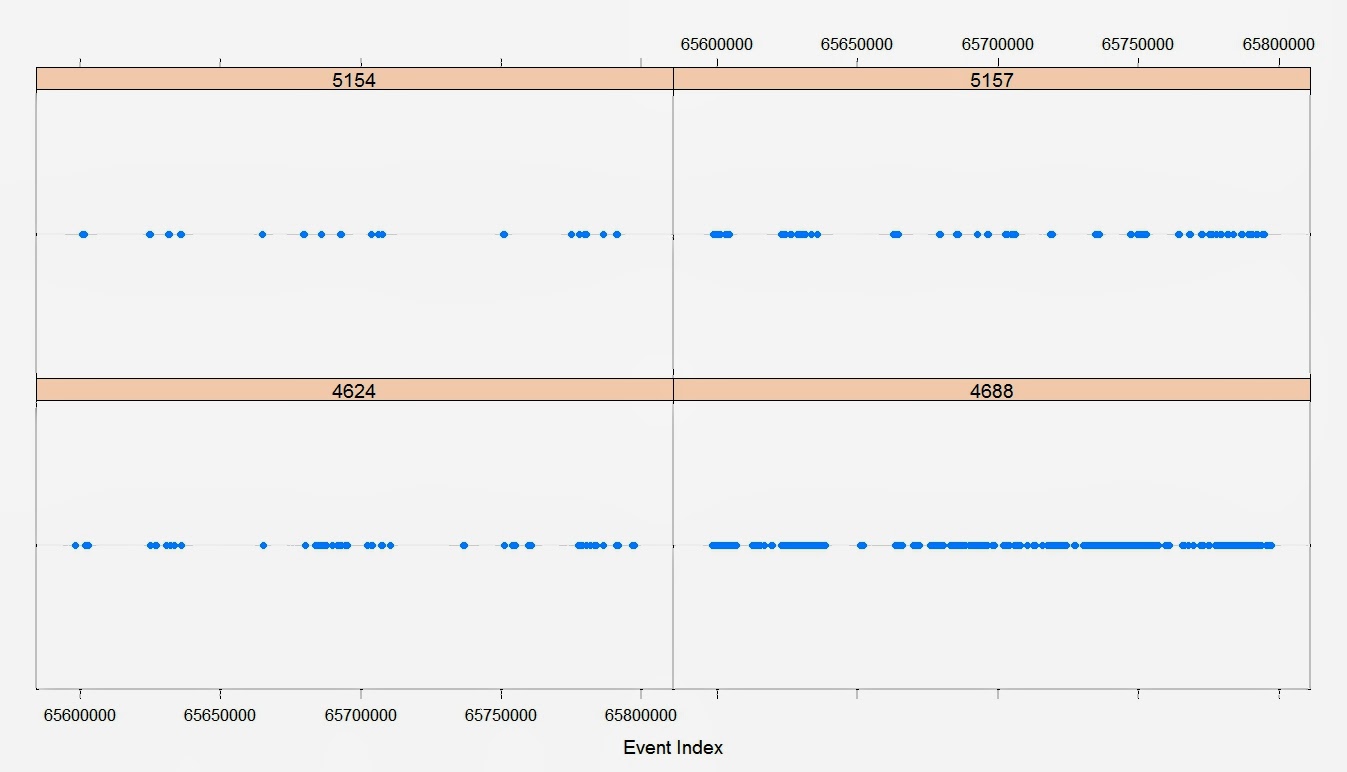
DF_TG <- data.frame(DF_TG[750:1250,1:3])
dotplot(~as.numeric(DF_TG$Index) | as.factor(DF_TG$EventID), xlab="Events (Time)")
 |
| Narrowing the Time. |
No comments:
Post a Comment